Note: The contents of this blog are accurate as of the day of publication. As we all know, open-source is constantly evolving. Please check out our most recent blogs for the most up-to-date information.
Pharma data science and engineering for clinical trials is a rapidly evolving field, and the incorporation of R programming language is one element that will make this ongoing evolution practical and feasible for years to come.
Let’s take a closer look at what R programming is, how to use it in the clinical trial space, and why pharma should be incorporating it at all.
Navigating the complexities of clinical trial analytics is easier with the right tools. Discover how R can revolutionize your data management.
You’ll learn:
- What Is R Programming?
- Key Features of R Programming
- How Is R Programming Used?
- Why Use R for Clinical Trial Analytics In Pharma?
- Who Is Already Using R in Pharma?
- What Are the Key Benefits of Using R In Pharma?
- Making the Transition to R Programming
- From SAS to R
- R Capabilities In Data Management and Cleaning
- R Capabilities in Data Visualization and Descriptive Statistics
- R Data Visualization
- Descriptive Statistics Using R
- R Capabilities In Meta-Analysis
- Multilingual Integrations to Incorporate R in Pharma
What Is R Programming?
R is a programming language and open-source software environment primarily used for statistical computing, data analysis, and data visualization. It was created by Ross Ihaka and Robert Gentleman at the University of Auckland, New Zealand, in the early 1990s; development began in 1992 and the first official R release occurred in 1995. Its creation was heavily influenced by the S programming language developed by John Chambers and his colleagues at Bell Laboratories in New Jersey in the late 1970s.
R is widely popular among statisticians, data scientists, and researchers for its extensive libraries and packages designed for statistical analysis and data manipulation.
Key Features of R Programming
- Data Manipulation: R provides powerful tools for data manipulation, transformation, and cleaning. It allows users to work with data frames, which are similar to tables in a relational database.
- Statistical Analysis: R offers a comprehensive set of statistical and mathematical functions for conducting a wide range of analyses, including regression analysis, hypothesis testing, clustering, and more.
- Data Visualization: R has a rich ecosystem of libraries for creating high-quality data visualizations. The most commonly used library for this purpose is ggplot2, which allows users to create customizable and publication-ready plots and charts.
- Extensibility: R is highly extensible, allowing users to create functions and packages. This extensibility has led to the development of a vast repository of over 20,000 R packages extending the language’s capabilities contributed by the community to address various analytical and data-related tasks.
- Reproducible Research: R is favored for reproducible research because it enables researchers to document and share their analyses systematically and transparently using tools such as R Markdown or Quarto.
- Integration: R can be integrated with other programming languages like C++, Java, JavaScript, and Python, or into other languages such as SAS, allowing users to leverage libraries from these languages when needed.
R’s popularity has grown significantly in the fields of data science, statistics, and academia due to its versatility and the vibrant R community — and it is now seeing significant expansion into the pharma space thanks to its strengths for use with clinical trial analytics.
R is commonly used for tasks such as data exploration, statistical modeling, machine learning, and generating reports with interactive visualizations. Additionally, R is often used in conjunction with tools like RStudio, which provides an integrated development environment (IDE) for R programming.
How Is R Programming Used?
R programming is used in a variety of ways across different domains for tasks related to data analysis, statistical modeling, data visualization, and more. Some common applications of R programming include:
- Data Analysis: R is widely used for data analysis tasks. Data analysts and data scientists use R to explore and clean data, summarize key statistics, and identify patterns and trends within datasets.
- Statistical Modeling: R provides a comprehensive set of tools for statistical modelling. Researchers and statisticians use R to build models for regression analysis, hypothesis testing, survival analysis, and many other statistical techniques.
- Data Visualization: R is known for its powerful data visualization capabilities. Data visualization specialists use R packages like ggplot2 and lattice to create a wide range of charts and plots, including scatter plots, bar charts, heatmaps, and more.
- Machine Learning: R has a growing ecosystem of machine learning packages, such as tidymodels, mlr3, caret, randomForest, and xgboost. Data scientists use these packages to build and evaluate machine learning models for tasks like classification, clustering, and regression.
- Bioinformatics: R is widely used in bioinformatics for tasks like gene expression analysis, DNA sequencing analysis, and the visualization of biological data.
- Academic Research: R is commonly used in academic research across various fields, including social sciences, environmental science, psychology, and more. Researchers use it to analyze and visualize data and publish their findings.
- Data Reporting and Visualization: R Markdown and Quarto allow users to create dynamic and reproducible reports that combine text, code, and visualizations. This is useful for generating automated reports and sharing results.
- Data Mining and Text Analysis: R offers tools for data mining tasks, sentiment analysis, and natural language processing, making it valuable for analyzing text data and unstructured information.
- Quality Control and Manufacturing: In industries like manufacturing, R is used for quality control analysis, process optimization, and production monitoring.
R’s flexibility, extensibility, and the availability of numerous packages and libraries make it a versatile tool for data-related tasks in various domains. Its open-source nature and active community support also contribute to its popularity and widespread use in data analysis and research. For those new to R, Atorus Academy is an excellent resource to help you get oriented.


Why Use R for Clinical Trial Analytics in Pharma?
Pharmaceutical companies can benefit from adopting R programming for a variety of reasons given its capabilities in data analysis, statistical modeling, and data visualization. Here are some of the most compelling reasons pharma should consider incorporating R into its workflows:
- Statistical Tools: R provides a rich set of statistical tools and packages that are essential for analyzing clinical trial data. The pharmaceutical industry relies heavily on statistical analysis, and R’s capabilities can enhance the accuracy and efficiency of these processes.
- Improved Data Presentation: R offers powerful data visualization libraries like ggplot2 and lattice, which enable the creation of informative and publication-quality graphs and plots. Visualizing data is crucial for presenting findings, identifying trends, and communicating results to stakeholders, regulatory bodies, and healthcare professionals.
- Reproducible Research: R promotes reproducible research practices through tools like R Markdown or Quarto. This is particularly important in the pharmaceutical industry, where transparency and traceability of data analysis and modeling are critical for regulatory compliance and scientific integrity.
- Customization and Extensibility: R is highly extensible, allowing pharmaceutical researchers to develop custom functions and packages tailored to their specific needs. This flexibility is valuable for addressing unique challenges and adapting to evolving research requirements.
- Integration With Databases: R can seamlessly integrate with existing databases, making it easier to manage and analyze large datasets stored in relational and many other types of databases. This is especially useful when dealing with clinical trial data, patient records, and other healthcare-related information.
- Predictive Modeling: R’s growing ecosystem of machine learning packages (e.g., tidymodels, caret, randomForest, and xgboost) empowers pharmaceutical companies to develop predictive models for drug discovery, drug development, toxicity prediction, and patient stratification.
- Cost-Effective Solution: R is open-source and free to use, which can result in cost savings compared to commercial statistical software. This is particularly relevant in an industry with stringent budget constraints.
- Community Support and Collaboration: R has a vibrant and active community of users and developers. Access to this community can facilitate collaboration, knowledge sharing, and the adoption of best practices within the pharmaceutical research community.
- Regulatory Compliance: R has been used in regulatory submissions to agencies such as the U.S. Food and Drug Administration (FDA) and the European Medicines Agency (EMA). Its acceptance in regulatory contexts underscores its suitability for adhering to regulatory compliance requirements.
- Time Efficiency: With the availability of numerous pre-built packages and functions, R can streamline data analysis workflows, potentially reducing the time required for research and development activities.
- Adaptation to Emerging Technologies: As the pharmaceutical industry incorporates more advanced technologies like genomics, proteomics, and electronic health records, R can be used to integrate and analyze data from these sources.
The decision to adopt R is often largely dependent on additional factors such as the existing skill set of the team, data infrastructure, and the specific needs of the pharmaceutical organization. Additionally, it’s crucial to ensure that data security, privacy, and regulatory compliance are maintained throughout the adoption process, especially when handling sensitive healthcare data.

Who Is Already Using R in Pharma?
Looking for some examples of who is already incorporating R programming into their clinical data systems? Pharmaverse is a networking space for such companies to connect, collaborate, share, and learn from one another as the industry increases R adoption.
What Are the Key Benefits of Using R in Pharma?
Using R programming in the pharmaceutical industry can significantly enhance research, development, and decision-making processes. In addition to the reasons outlined in the “Why Use R in Pharma?” section above, here are some other key benefits of using R in pharma to be aware of.


- Advanced Data Analysis: R provides a comprehensive set of statistical and data analysis tools that allow pharmaceutical researchers to analyze complex datasets, perform hypothesis testing, and gain deeper insights into experimental and clinical trial data.
- Quality Control and Assurance: R can be used for quality control analysis, ensuring that pharmaceutical products meet rigorous quality standards and specifications.
- Decision Support: R’s data analysis and modeling capabilities can provide valuable insights for making informed decisions related to drug development, clinical trials, patient outcomes, and regulatory compliance.
- Drug Safety and Pharmacovigilance: R can be used for pharmacovigilance activities, such as adverse event analysis, signal detection, and risk assessment for pharmaceutical products and assessing the efficacy and safety of drugs.
Overall, R programming can significantly enhance the efficiency, accuracy, and transparency of research and decision-making processes. Its wide-ranging capabilities make it a valuable tool for data analysis, modeling, and reporting in drug development, clinical trials, and regulatory compliance efforts.
Making the Transition to R Programming
Transitioning to R programming in the clinical research space can be a valuable step to enhancing your data analysis and research capabilities. Wondering where to begin? Here are some steps and considerations for those looking to make this transition:
- Learn the Basics of R: Start by learning the fundamentals of R, including syntax, data structures, and basic functions. There are many online resources, tutorials, and courses available for beginners. As mentioned above, Atorus Academy is an excellent starting point for you and your team.
- R Installation and Setup: R installation for your team may include an integrated development environment (IDE) like RStudio, which provides a user-friendly interface and tools for R programming. This isn’t a step you have to navigate on your own; help is available.
- Data Import and Manipulation: Familiarize yourself with R’s data import and manipulation capabilities. Learn how to read data from various file formats (e.g., CSV, Excel, and databases) and perform common data cleaning and transformation tasks.
- Statistical Analysis and Modeling: Explore R’s statistical packages and functions for data analysis. Practice performing basic statistical tests, hypothesis testing, and data exploration.
- Data Visualization: Learn how to create effective data visualizations using R’s visualization libraries, such as ggplot2. Visualization is crucial for presenting clinical research findings.
- Reproducible Research: Understand the concept of reproducible research in R. Learn to use tools like R Markdown or Quarto to document and share your analysis workflows and results in a transparent and reproducible manner.
- Clinical Data Handling: If working with clinical trial data, familiarize yourself with specialized R packages for clinical data management and analysis, such as CDISC standards and package collections like tidyverse.
- Pharmaceutical and Regulatory Context: Study relevant case studies and examples to see how R is applied in clinical research, pharmacokinetics, pharmacodynamics, and regulatory submissions.
- Consider Regulatory Compliance: If your work involves regulatory submissions, ensure that your R-based workflows and documentation adhere to regulatory compliance standards, such as those set by the FDA or EMA. Tap into our OpenVal collection to ensure you’re always working with validated R packages.
- Join R Communities: Join online communities, forums, and LinkedIn groups focused on R programming in clinical research. Engaging with peers can provide valuable insights and support.
- Practice and Projects: Practice what you learn by working on small projects or using sample clinical datasets. Hands-on experience is essential for mastering R programming.
- Stay Updated: Keep up with the latest developments in R and its packages. The R ecosystem evolves continuously, so staying informed about new features and best practices is important. The Atorus Resources Library is a great source to help keep you informed.
Transitioning to R programming in clinical research may require time and effort, but it can significantly enhance your ability to conduct robust data analysis, produce reproducible research, and make data-driven decisions in the clinical research space.
As you gain proficiency in R, you’ll be better equipped to contribute to the advancement of clinical research and drug development processes.
From SAS to R
The transition from a strictly SAS-capable programming team to a team capable of using R as needed is not only possible, it’s the wave of the future for the pharma industry. Here’s a recent article we wrote on this topic with a detailed SAS to R example.


R Capabilities in Data Management and Cleaning
R offers robust capabilities for data management and cleaning, making it a powerful tool in the field of data science and analysis — including key strengths such as:
- Data Import: R can seamlessly import data from various sources, including spreadsheets, databases, web APIs, and more. This flexibility allows users to work with diverse datasets.
- Data Transformation: R provides a wide range of functions for data transformation, such as reshaping, merging, and aggregating data. This helps prepare raw data for analysis by restructuring it into a suitable format.
- Data Cleaning: R facilitates data cleaning through functions that detect and handle missing values, outliers, and inconsistencies. Users can impute missing data, remove duplicates, and correct errors in a systematic manner.
- Data Exploration: R’s capabilities for summarizing and exploring data enable users to gain insights into dataset characteristics, including summary statistics, distribution visualizations, and data profiling.
- Data Validation: R allows users to perform data validation checks to ensure data quality and adherence to predefined rules or constraints. This is crucial for maintaining data integrity.
- String Manipulation: R excels in handling text data, providing tools for string manipulation, regular expressions, and text extraction, making it useful for natural language processing and text analysis.
- Data Conversion: R can convert data types, such as changing dates to the desired format, which is essential for compatibility with analysis functions.
- Data Subset Selection: R makes it easy to extract specific subsets of data based on conditions or criteria, allowing users to focus on relevant portions of the dataset.
- Data Export: R provides various export options, allowing users to save cleaned and transformed data in different file formats for further analysis or sharing.
- Reproducibility: R’s script-based approach to data cleaning ensures that the entire data cleaning process can be documented, shared, and reproduced, promoting transparency, traceability, and reproducible research.
Overall, R’s data management and cleaning capabilities empower data analysts and scientists to efficiently preprocess data, improving data quality and integrity. These capabilities are essential for the foundation of sound data analysis, modeling, and decision-making in the pharmaceutical industry.
R Capabilities in Data Visualization and Descriptive Statistics
R is renowned for its powerful data visualization and descriptive statistics capabilities, making it an invaluable tool for data analysts and scientists.
R Data Visualization
R excels in data visualization with libraries like ggplot2, which allows users to create a wide range of visually appealing and informative plots and charts. R’s graphics are highly customizable, enabling users to tailor visualizations to specific needs. It supports various plot types, including scatter plots, bar charts, histograms, box plots, heatmaps, and more. Interactive visualization packages like plotly and Shiny provide dynamic, web-based displays for enhanced exploration and communication of data.
R’s graphics can be integrated into reports and presentations, making it a preferred choice for sharing insights with stakeholders and decision-makers. Here’s an example we shared of building a ggplot2 theme.
Descriptive Statistics Using R
R offers a comprehensive suite of functions for descriptive statistics, allowing users to summarize and explore data quickly. Users can calculate common statistics such as mean, median, standard deviation, and percentiles, as well as generate summary tables and frequency distributions. R also provides tools for cross-tabulation, correlation analysis, and data profiling.
With the dplyr and tidyr packages, users can efficiently reshape and transform data to facilitate descriptive analysis. R’s integration of descriptive statistics with data visualization enables analysts to gain deeper insights into data patterns, making it a robust platform for both exploratory data analysis and reporting.
R Capabilities in Meta-Analysis
R is a powerful and versatile tool for conducting meta-analysis, a statistical technique used to synthesize and analyze the results of multiple studies on the same topic. R provides a comprehensive ecosystem of packages and functions specifically designed for meta-analysis.
Researchers and statisticians in various fields — including healthcare, social sciences, and economics — rely on R for its robust capabilities in this area. Now, the pharmaceutical industry is coming to rely on it for this purpose, as well.
- Meta-Analysis Data Preparation: tidyverse, including dplyr and tidyr, empowers researchers to efficiently collect, clean, and format data from diverse sources, making it ready for meta-analysis.
- Effect Size Computation and Visualization: R’s meta-analysis packages provide functions for calculating effect sizes like standardized mean differences and odds ratios. Visualizations like forest plots and funnel plots, created with packages like metafor, offer insights into effect size distributions and precision across studies.
- Meta-Regression and Subgroup Analysis: R’s meta-analysis capabilities extend to meta-regression and subgroup analyses, allowing researchers to explore covariate effects and investigate potential heterogeneity. Packages like metacor and meta are valuable for these tasks.
- Publication Bias Assessment: Packages like dmetar facilitate publication bias assessment using funnel plot asymmetry tests and statistical methods such as Egger’s test.
- Statistical Models: R supports a wide range of statistical models for meta-analysis, including fixed-effects and random-effects models. The metafor package, in particular, offers flexibility in modeling.
- Customization and Reporting: Researchers can customize their meta-analysis workflows and generate reproducible reports with R Markdown and Quarto, ensuring transparency and facilitating collaboration.
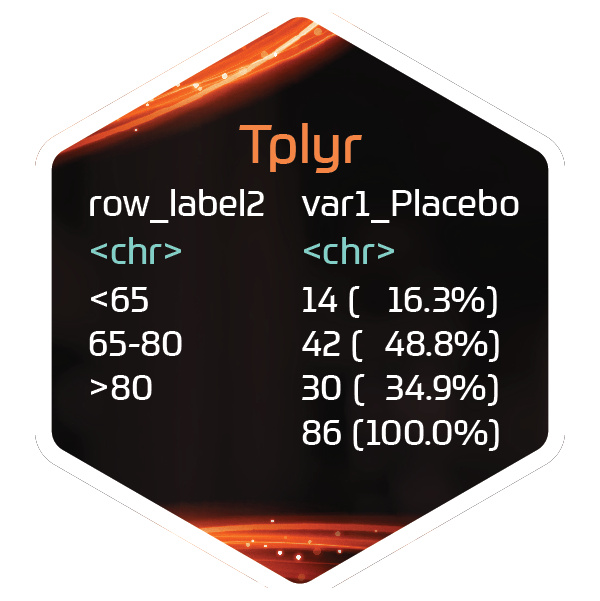
- Advanced Tools: The Tplyr package enhances data manipulation capabilities within the tidyverse framework. (Check out the novel and dynamic functionalities of Tplyr in this presentation.)
In summary, R is a comprehensive platform for conducting meta-analysis, offering a wide range of tools for data preparation, effect size computation, visualization, and statistical modeling. Its open-source nature and active community ensure that researchers have access to the latest advancements and methodologies.
Multilingual Integrations to Incorporate R in Pharma
Using multiple programming languages in the pharmaceutical industry can be advantageous for various tasks, including data analysis, modeling, and software development. Here are some common scenarios where multiple programming languages are beneficial:
- Data Analysis and Statistics: R and Python are commonly used for data analysis and statistical modeling. R excels in statistical analysis and data visualization, while Python offers versatility and strong libraries for data manipulation.
- Machine Learning and Artificial Intelligence: Python is a dominant language for machine learning and AI in pharma. Libraries like scikit-learn, TensorFlow, and PyTorch facilitate the development of predictive models for drug discovery, patient stratification, and adverse event prediction.
- Clinical Trial Data Management: SAS is a traditional choice for managing and analyzing clinical trial data, thanks to its extensive capabilities for data manipulation, analysis, and reporting. It is often used alongside R or Python for specific analytical tasks.
- Regulatory Compliance: Languages like Python, R, and SAS are utilized for generating regulatory submissions, ensuring that data meets regulatory standards, and conducting statistical analyses for regulatory approval.
- Custom Software Development: Pharmaceutical companies often develop custom software and tools to support research and development efforts. Open-source languages like R are useful for collaboration in these scenarios.
- Data Visualization: Besides R and Python, tools like Tableau, Power BI, and D3.js are used for creating interactive and dynamic data visualizations and reports.
Pharmaceutical companies often adopt a polyglot approach, choosing the most appropriate programming language for specific tasks within their workflows. Effective integration and communication between these languages are essential to ensure seamless data flow and collaboration across different teams and departments. Additionally, ensuring regulatory compliance, data security, and data integrity remains paramount.
R Integration: In Conclusion
In summary, implementing R programming into your clinical data management team and processes is simpler than you might think. Atorus has unlocked the best training methods to uplevel your team quickly so you can see the positive effects of a multilingual approach very quickly.